This post is part of the free monthly snapshot series. Subscribe via email for the latest updates, or upgrade to the professional edition for full data access.
Harvests and Agriculture
Who Keeps What the Pacific Northwest Grows — Free Edition
2026-10 | Generated by Mamook LLC
The Pattern
The Pacific Northwest sold $30.4 billion worth of agricultural products in 2022, off 40,699,156 acres worked by 90,500 farms and ranches. The question this issue asks is not how much the region grows. It is who keeps what the region grows — land, or labor.
Measured directly rather than inferred from who owns the farms, hired farm labor across the region’s counties came to 155,800 workers paid $6.1 billion in wages — 19.9% of the market value of everything sold. The other four-fifths accrued to land, capital, and ownership. (5 counties are fully suppressed in the federal labor release because too few employers report to disclose them; they are excluded from these totals rather than counted as zero, so the real labor share is somewhat higher by an amount the federal data does not let us state.)
That regional average hides two opposite agricultural economies. In Morrow County, Oregon — irrigated commodity crops, cattle feeding, potato processing — wages are 6.8% of farm sales, and the county turns $835,151 of sales per worker. In Yakima County, Washington — fruit, hops, wine, nursery — wages are 46.8%, and the county turns $78,067 per worker. Same region, same census, 40 percentage points apart in who the harvest pays. But the county paying out the largest share of its harvest as wages is not the county where farmworkers do best. Yakima’s 29,020 farmworkers — the largest agricultural workforce in the region by a wide margin — average $36,505 a year, below the regional farm-labor average of $38,865. A bigger slice of a county’s farm economy reaching payroll is not the same as any individual paycheck being enough to live on. Spread across a large, seasonal workforce, a high labor share and low pay are the same fact seen from two different heights.
Then there is the land the federal government already recognizes as someone else’s. Inside the Yakama Reservation’s own boundaries, USDA counts 261 farms, of which 31 — 11.9% — are operated by American Indian or Alaska Native producers. Those farms capture 8.8% of the reservation’s farm sales and 8.2% of its hired-labor spending. Roughly nine dollars in ten of both the revenue and the wage economy built on that land flow to non-Native operators. That is the arithmetic of allotment-era checkerboarding, still running.
The Map
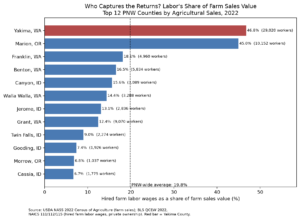
Hired farm wages as a share of the market value of agricultural sales, Pacific Northwest counties, 2022. Sources: USDA NASS 2022 Census of Agriculture; U.S. Bureau of Labor Statistics Quarterly Census of Employment and Wages, 2022 annual averages, NAICS 111/112/115. 5 counties fully suppressed in the public QCEW release are excluded rather than entered as zero. Federal agricultural and labor series exclude tribal economic indicators; reservation economies are not separately represented in the county figures.
Key Numbers
| Metric | Value |
|---|---|
| PNW agricultural sales, 2022 | $30.4 billion |
| Hired farm workers | 155,800 |
| Wages as a share of farm sales | 19.9% |
| Average farm-labor pay | $38,865 / year |
| Labor share — Yakima vs. Morrow County | 46.8% vs. 6.8% |
| AI/AN share of farm sales on the Yakama Reservation | 8.8% |
| Counties: above-median sales and above-median child poverty | 28 |
Sources: USDA NASS 2022 Census of Agriculture (county totals and the American Indian Reservations subject report); U.S. Bureau of Labor Statistics QCEW 2022 annual averages, NAICS 111/112/115; U.S. Census Bureau, American Community Survey 2022 5-Year Estimates; Statistics Canada 2021 Census of Agriculture. 5 counties are fully suppressed in the public QCEW release and excluded from labor totals. All figures preliminary and subject to revision by the issuing agencies.
Watch land tenure before you watch school budgets. Consolidation — non-family corporate ownership, LLC-held ground, out-of-state investment vehicles — shows up in the agricultural census years before it shows up in per-pupil spending, and it is the mechanism that decides whether a billion-dollar harvest becomes a tax base or a transfer. Across the region 12.3% of children under 18 lived in poverty in 2022; 17 counties exceed 20%, and 28 counties combine above-median farm sales with above-median child poverty. Productivity and community income are not the same variable, and nothing in the data makes the first produce the second on its own.
This is v1.0 of this issue. Two figures were corrected before publication, on 2026-09-25, when the published tiers were first generated from source data rather than from the reviewed draft: the regional wage share was written as 19.8% and computes to 19.9% (the claims audit passed the original because 0.55% relative error sits inside its 1% tolerance); and Morrow County was described as the region’s sales-per-worker extreme, which Elmore County, Idaho exceeds. Both corrections are documented in the professional edition’s data package. Every figure in this issue is computed from the source files at render time; none is transcribed.
This data comes from the traditional and ancestral territories of the Yakama, Umatilla, Warm Springs, Nez Perce, Coeur d’Alene, Shoshone-Bannock, Chinook, Clatsop, Tillamook, Cowlitz, Siletz, Coos, and many other Pacific Northwest nations. These nations govern their lands today.
Federal data does not include tribal economic indicators. The Yakama Reservation figures in this issue are federal statistics about tribal land, published by a federal agency — they are not a Yakama Nation data product, carry no Tribal endorsement, and should be read alongside tribal sources and community knowledge rather than in place of them. Rural Alaska food systems are absent from this issue: no dataset comparable to NASS, ACS, or QCEW was found at this geography, and that gap is documented here rather than filled with a weaker proxy.
Want the full picture?
The professional PNW Economic Atlas includes the county-by-county labor and land split for every county in the region, the Fraser Valley cross-border comparison, the full Yakama Reservation tenure analysis, raw data downloads, and interactive maps.
Get this snapshot delivered to your inbox every month — subscribe free. For professionals who need the full interactive maps, raw data, and alerts: PNW Economic Atlas ($200/mo).