This post is part of the free monthly snapshot series. Subscribe via email for the latest updates, or upgrade to the professional edition for full data access.
Neighboring Inequalities
Where Wealth and Poverty Share a Border in the PNW — Free Edition
2026-08 | Generated by Mamook LLC
The Pattern
The Pacific Northwest does not have one economy. It has many, pressed up against one another at the scale of a census tract. Across 3,211 tracts in Oregon, Washington, and Idaho, income is highly spatially clustered — wealthy tracts border wealthy tracts, poor tracts border poor tracts. The headline number is a Moran’s I of 0.64 for median household income (p < 0.001): if you know a tract's income, you can make a strong guess about its neighbors'.
Extreme boundaries — a top-decile tract directly touching a bottom-decile tract — are rare: only 16 in the whole region. The largest single gap is in Census Tract 246.02; King County; Washington, where the median household income is top-coded at $250,001 and the neighboring tract’s average is $123,246 — a gap of $126,755.
The Map
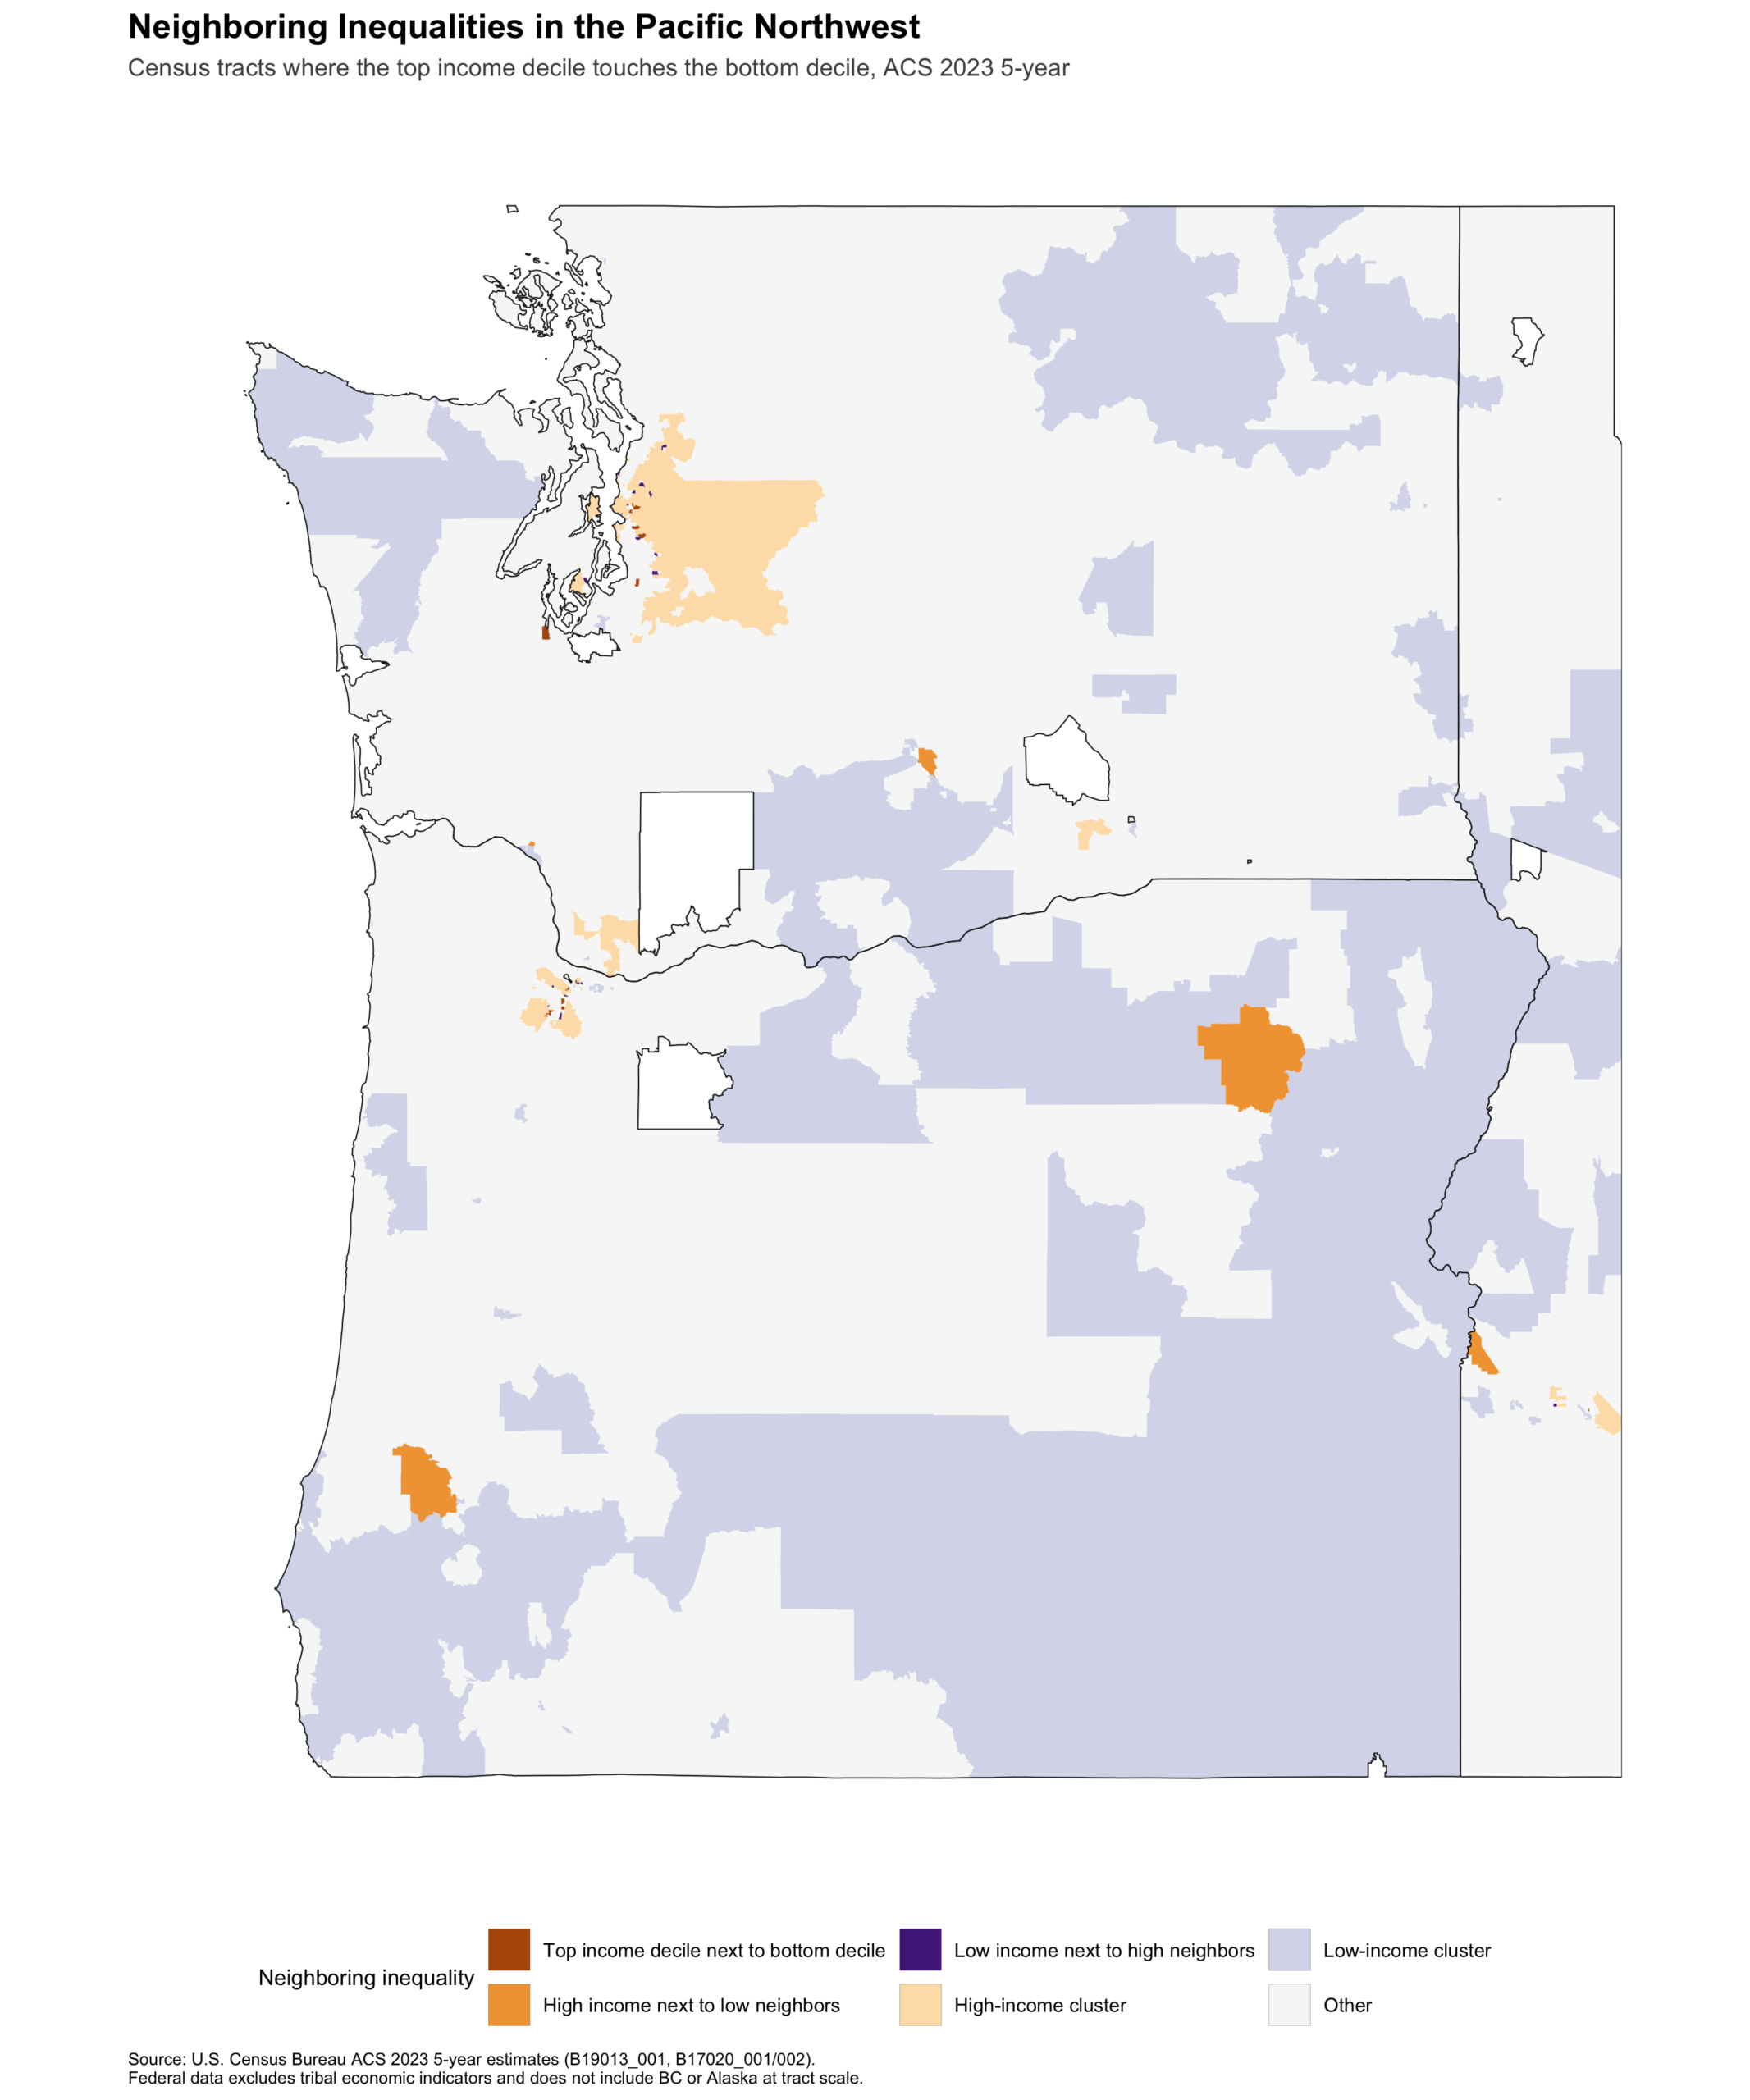
Census tracts classified by LISA income clusters and extreme boundary status, ACS 2023 5-year estimates. Orange tracts are in the top income decile and touch at least one tract in the bottom decile. Purple tracts are low-income islands next to high-income neighbors. Federal data excludes tribal economic indicators and does not include British Columbia or Alaska at tract scale.
Key Numbers
| Metric | Value |
|---|---|
| Moran’s I for median income (spatial clustering) | 0.64 (p < 0.001) |
| Tracts in high-wealth clusters | 421 |
| Tracts in high-poverty clusters | 273 |
| Extreme income boundaries | 16 |
| Largest single tract-neighbor income gap | $126,755 (Census Tract 246.02; King County; Washington) |
Source: U.S. Census Bureau, American Community Survey 2023 5-Year Estimates. All figures preliminary and subject to revision.
Watch the extreme boundaries in metro counties. The 16 top-decile tracts touching bottom-decile tracts are the front lines of displacement. If housing costs continue to rise faster than wages in Portland, Seattle, and Boise, the number of extreme boundaries will grow, and the low-income side will shrink or move outward.
This data comes from the traditional and ancestral territories of the Chinook, Clatsop, Tillamook, Warm Springs, Cowlitz, Puyallup, Suquamish, Lummi, Yakama, Umatilla, Nez Perce, Shoshone-Bannock, Coeur d’Alene, and many other Pacific Northwest nations.
Federal data does not include tribal economic indicators. The omission is a methodological limitation, not a claim that these economies do not exist.
Want the full picture?
The professional PNW Economic Atlas includes the full county-by-county breakdown, the Deschutes County block-group case study, extreme-boundary tract listings, raw data downloads, and interactive maps.
Get this snapshot delivered to your inbox every month — subscribe free. For professionals who need the full interactive maps, raw data, and alerts: PNW Economic Atlas ($200/mo).