Land Acknowledgment
This work traverses the traditional and ancestral territories of the Ts'msyen (Tsimshian), Nisga'a, Gitxsan, Wet'suwet'en, Carrier, and Nuxalk peoples, and many other Pacific Northwest and Plateau nations. These nations govern their lands today. The port's geographic advantage is a function of this territory; its logistics value cannot be separated from the lands and waters that make it possible.
Mamook does not conduct or represent Indigenous consultation. Consultation on this corridor is government-to-government and nation-to-nation. This study offers analytical support only, and claims no endorsement by any First Nation, port authority, or carrier. Indigenous territory boundaries referenced in this project are credited to Native Land Digital.
Executive summary
Measured end to end — sailing from Asia, terminal dwell, and rail inland — Prince Rupert reaches Chicago in 17.15 days. That is 2.03 days ahead of Vancouver BC, the next fastest option, and 5.67 days ahead of Los Angeles / Long Beach.
- Sailing from Asia
- 253.2 hrs
Mean across four Asian origin ports at 18 knots.
- Terminal dwell
- 60 hrs
PRPA published target: under 2.5 days.
- Rail to Chicago
- 98.4 hrs
CN northern mainline, sourced lane figure.
- Total transit
- 17.15 days
17.2 days (411.6 hrs)
Methodology
Maritime distances are published practical sea-lane distances — NGA Pub. 151 Distances Between Ports where the pair is listed, and composites of Pub. 151 legs or routed values where it is not. Per-pair provenance travels with the data. Sailing times assume a mean vessel speed of 18 knots: the pre-2008 22-knot service speed no longer holds under slow steaming, and the global container fleet now averages roughly 15–16 knots.
Rail corridor geometries and distances are measured, not estimated: each port-to-hub lane is a shortest path over OpenStreetMap main-track rail, Dijkstra-stitched from a tiled Overpass extract. 18 lanes are measured this way and 0 remain schematic. Measured distances are shortest-path network values, not carrier routing guarantees. Rail transit times are sourced per lane where a primary carrier or port figure exists, and tagged illustrative elsewhere.
1. Distance from Asia
Mean published sea-lane distance from four major Asian origin ports. Geography and sailed distance diverge here: Vancouver lies farther north than Seattle, yet ranks below it on practical routing, because vessels bound for Vancouver transit the Strait of Juan de Fuca and then steam back north.
| Rank | Port | Mean distance (nm) | Sailing time (hrs @ 18 kn) |
|---|---|---|---|
| 1 | Prince Rupert | 4,558.2 | 253.2 |
| 2 | Port Edward (PR bulk) | 4,558.2 | 253.2 |
| 3 | Seattle / Tacoma (NWSA) | 5,004.2 | 278.0 |
| 4 | Vancouver BC | 5,043.0 | 280.2 |
| 5 | Portland OR | 5,097.2 | 283.2 |
| 6 | Oakland CA | 5,225.5 | 290.3 |
| 7 | Los Angeles / Long Beach | 5,536.8 | 307.6 |
2. Harbour depth and terminal dwell
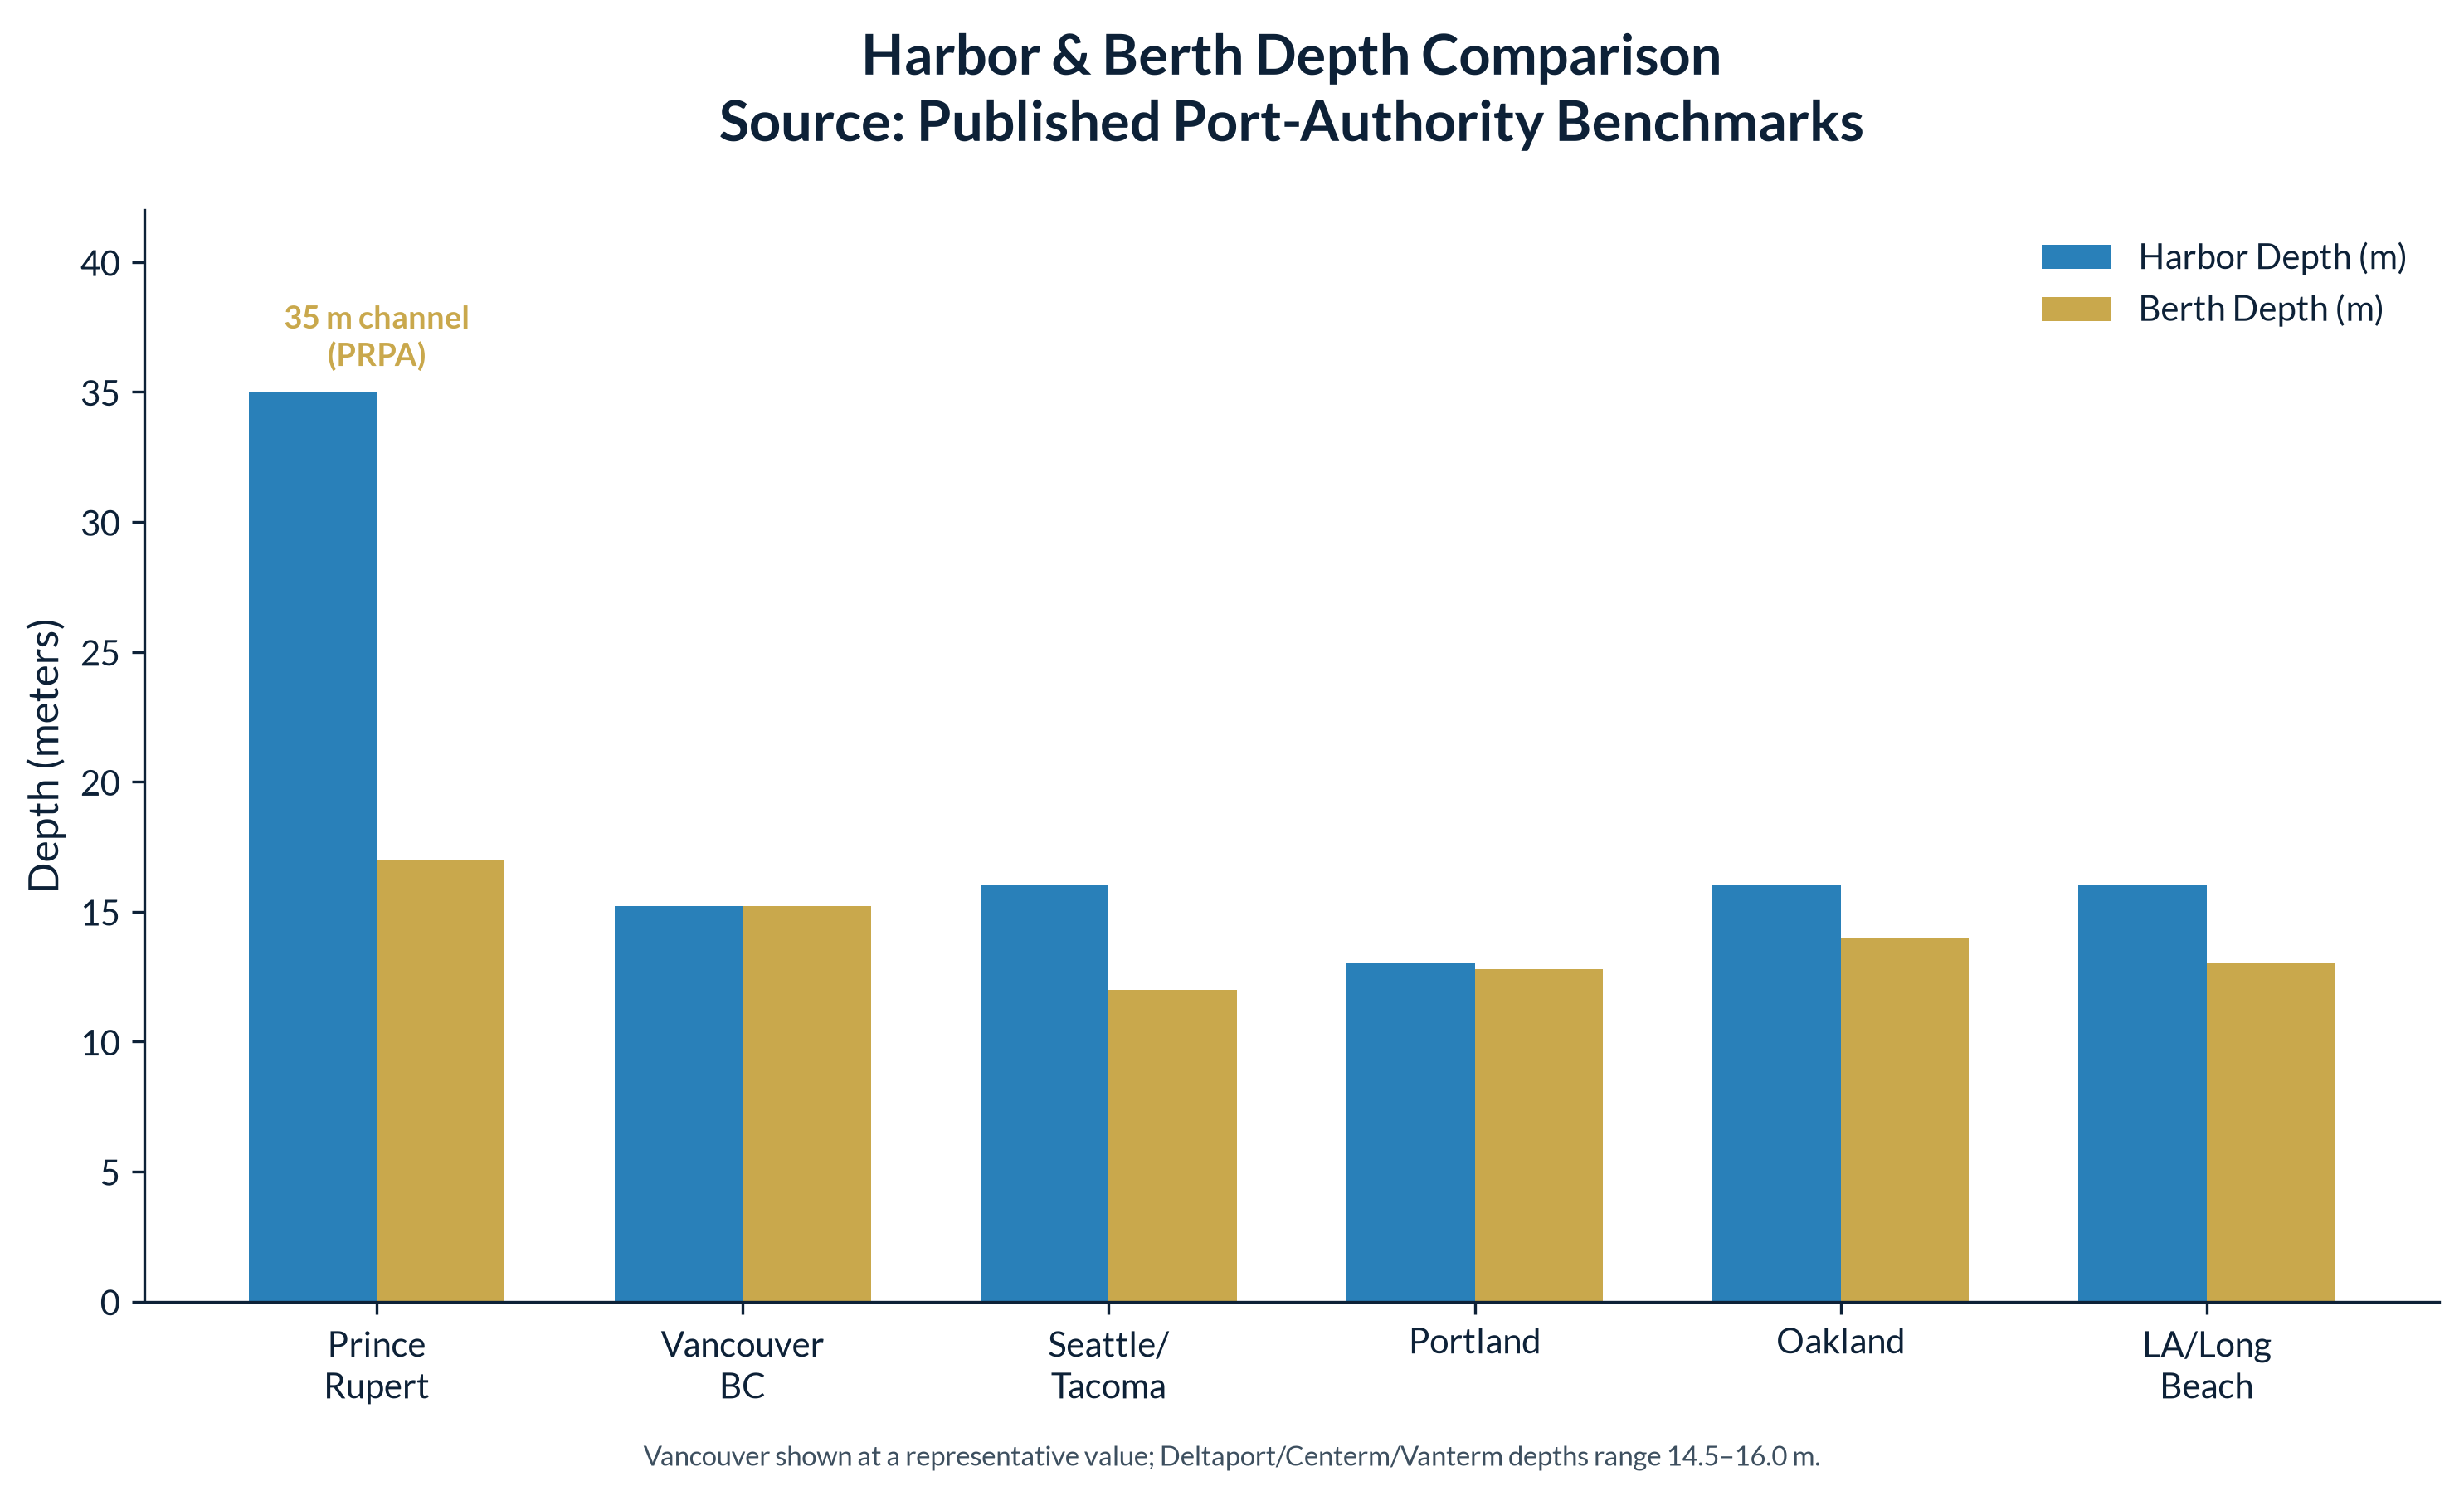
| Port | Harbour depth (m) | Berth depth (m) | Dwell (hrs) | Dwell basis | Congestion | On-dock rail |
|---|---|---|---|---|---|---|
| Port Edward (PR bulk) | 35.0 | 18.0 | 48 | Assumption | Low | Yes |
| Prince Rupert | 35.0 | 17.0 | 60 | Sourced | Low | Yes |
| Vancouver BC Terminal-specific depths at Deltaport, Centerm, and Vanterm range 14.5–16.0 m; 15.2 m is a representative mid-range value used for comparison. | 15.2 | 15.2 | 72 | Sourced | Moderate | Yes |
| Portland OR | 13.0 | 12.8 | 84 | Illustrative | Low | No |
| Seattle / Tacoma (NWSA) | 16.0 | 12.0 | 96 | Illustrative | Moderate-High | Yes |
| Oakland CA | 16.0 | 14.0 | 108 | Illustrative | High | Yes |
| Los Angeles / Long Beach | 16.0 | 13.0 | 120 | Sourced | Severe | Yes |
Dwell times marked "Illustrative" are comparative placeholders, not published operator figures. Repeated documented searches found no authoritative container dwell series for Portland OR, Seattle / Tacoma (NWSA), Oakland CA; hover any badge for the full provenance note. The Port Edward (PR bulk) figure is marked "Assumption": a deliberate modelling choice for an adjacent facility with no published dwell target, not a missing datum. Treating any of these as sourced data would overstate the precision of every total that depends on them.
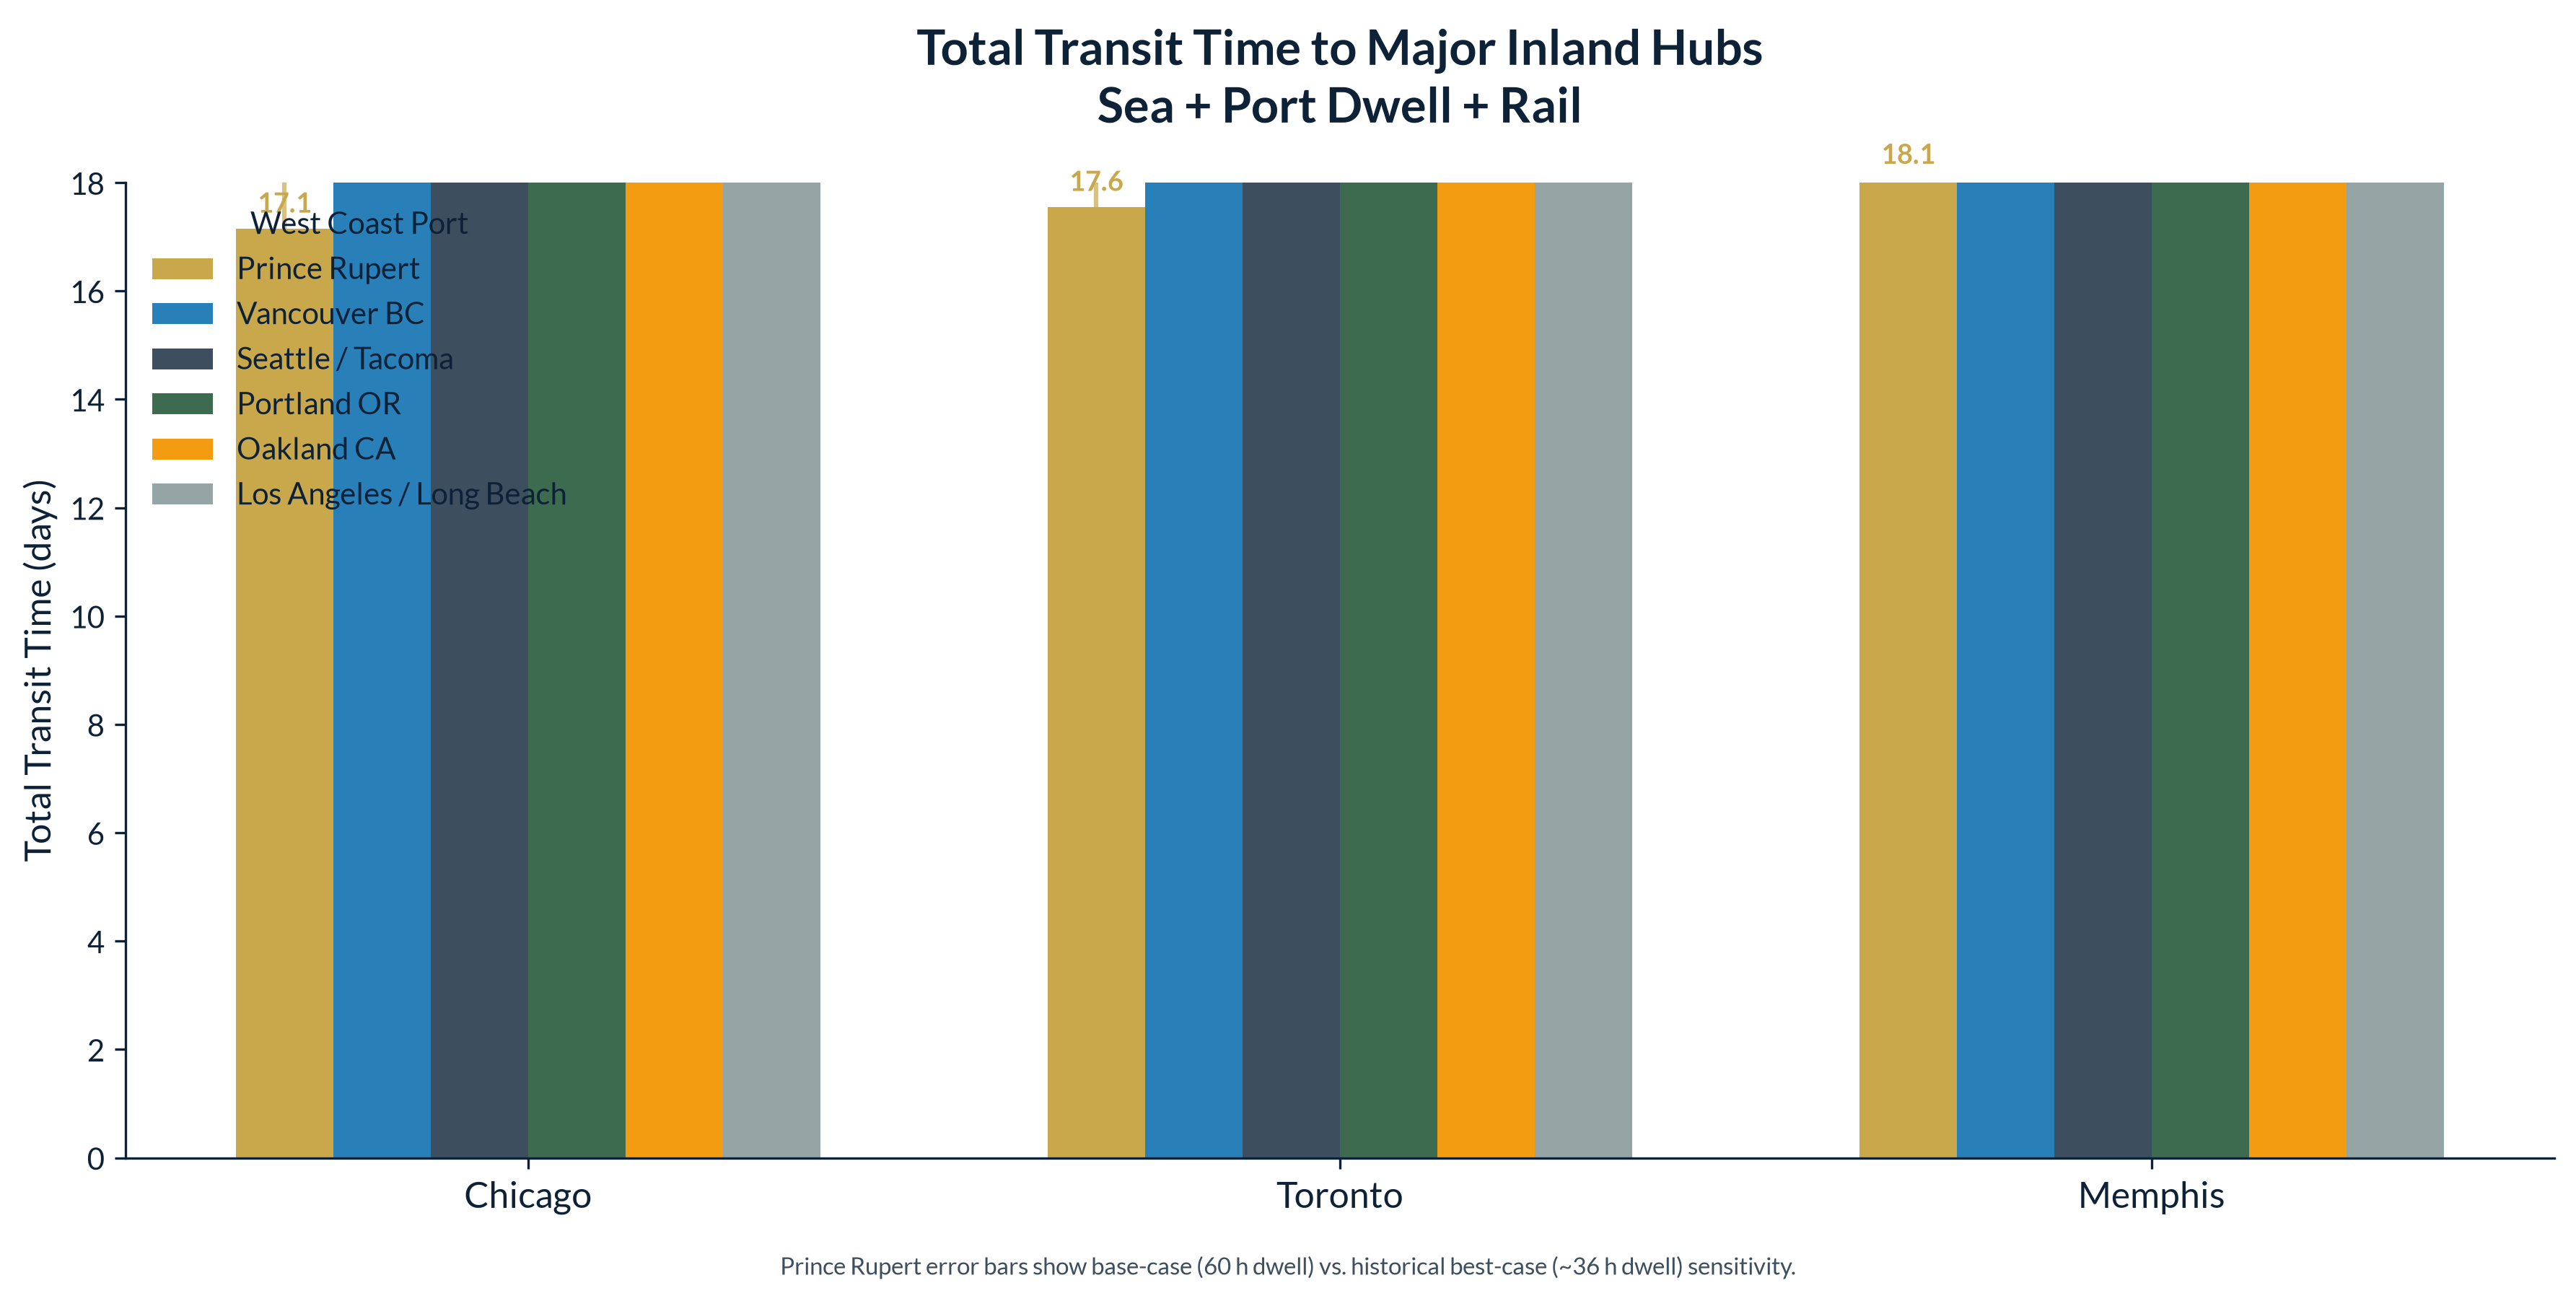
3. Total transit time by port and inland hub
Sailing plus terminal dwell plus rail, for each West Coast port against three inland hubs. Fastest first.
| Port | Sailing (hrs) | Dwell (hrs) | Rail (hrs) | Total (hrs) | Total (days) |
|---|---|---|---|---|---|
| Prince Rupert | 253.2 | 60 | 98.4 | 411.6 | 17.15 |
| Vancouver BC | 280.2 | 72 | 108.0 | 460.2 | 19.18 |
| Seattle / Tacoma (NWSA) | 278.0 | 96 | 96.0 | 470.0 | 19.58 |
| Portland OR | 283.2 | 84 | 132.0 | 499.2 | 20.80 |
| Oakland CA | 290.3 | 108 | 120.0 | 518.3 | 21.60 |
| Los Angeles / Long Beach | 307.6 | 120 | 120.0 | 547.6 | 22.82 |
| Port | Sailing (hrs) | Dwell (hrs) | Rail (hrs) | Total (hrs) | Total (days) |
|---|---|---|---|---|---|
| Prince Rupert | 253.2 | 60 | 108.0 | 421.2 | 17.55 |
| Vancouver BC | 280.2 | 72 | 108.0 | 460.2 | 19.18 |
| Seattle / Tacoma (NWSA) | 278.0 | 96 | 144.0 | 518.0 | 21.58 |
| Portland OR | 283.2 | 84 | 156.0 | 523.2 | 21.80 |
| Oakland CA | 290.3 | 108 | 144.0 | 542.3 | 22.60 |
| Los Angeles / Long Beach | 307.6 | 120 | 144.0 | 571.6 | 23.82 |
| Port | Sailing (hrs) | Dwell (hrs) | Rail (hrs) | Total (hrs) | Total (days) |
|---|---|---|---|---|---|
| Prince Rupert | 253.2 | 60 | 120.0 | 433.2 | 18.05 |
| Vancouver BC | 280.2 | 72 | 132.0 | 484.2 | 20.18 |
| Portland OR | 283.2 | 84 | 144.0 | 511.2 | 21.30 |
| Oakland CA | 290.3 | 108 | 120.0 | 518.3 | 21.60 |
| Seattle / Tacoma (NWSA) | 278.0 | 96 | 168.0 | 542.0 | 22.58 |
| Los Angeles / Long Beach | 307.6 | 120 | 120.0 | 547.6 | 22.82 |
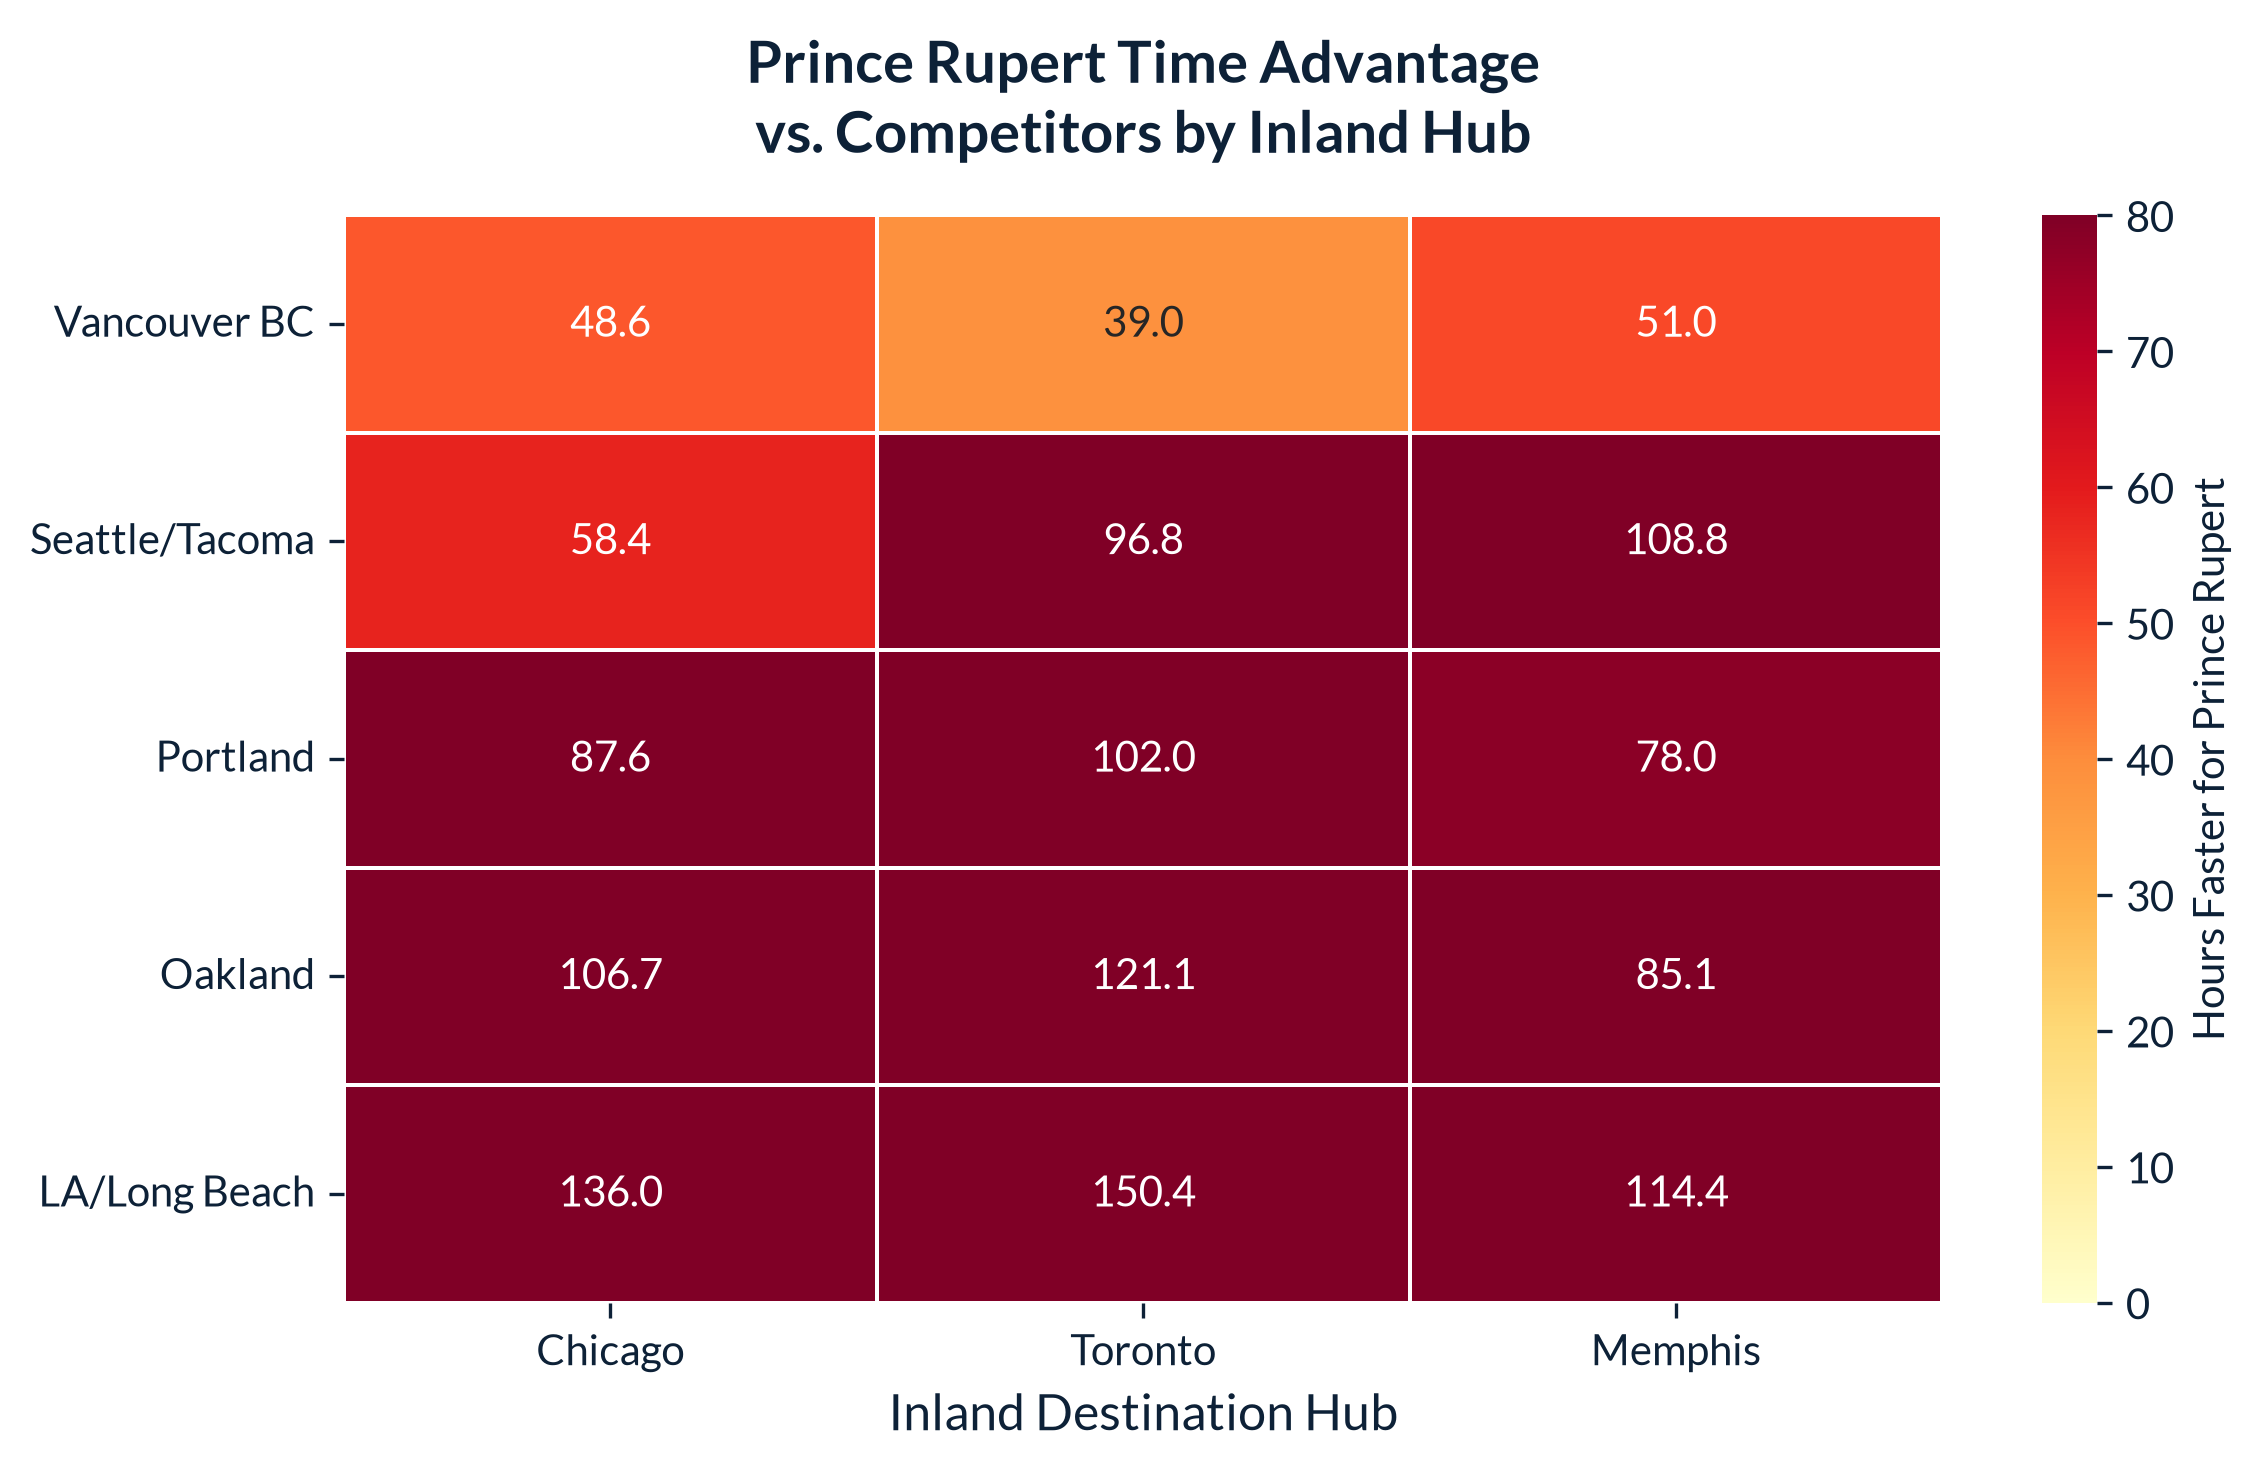
4. Time saved via Prince Rupert
Hours saved by routing through Prince Rupert instead of each competing port. Positive values mean Prince Rupert is faster.
| Compared with | Chicago | Toronto | Memphis |
|---|---|---|---|
| Los Angeles / Long Beach | 136.0 | 150.4 | 114.4 |
| Oakland CA | 106.7 | 121.1 | 85.1 |
| Portland OR | 87.6 | 102.0 | 78.0 |
| Seattle / Tacoma (NWSA) | 58.4 | 96.8 | 108.8 |
| Vancouver BC | 48.6 | 39.0 | 51.0 |
5. Landed cost
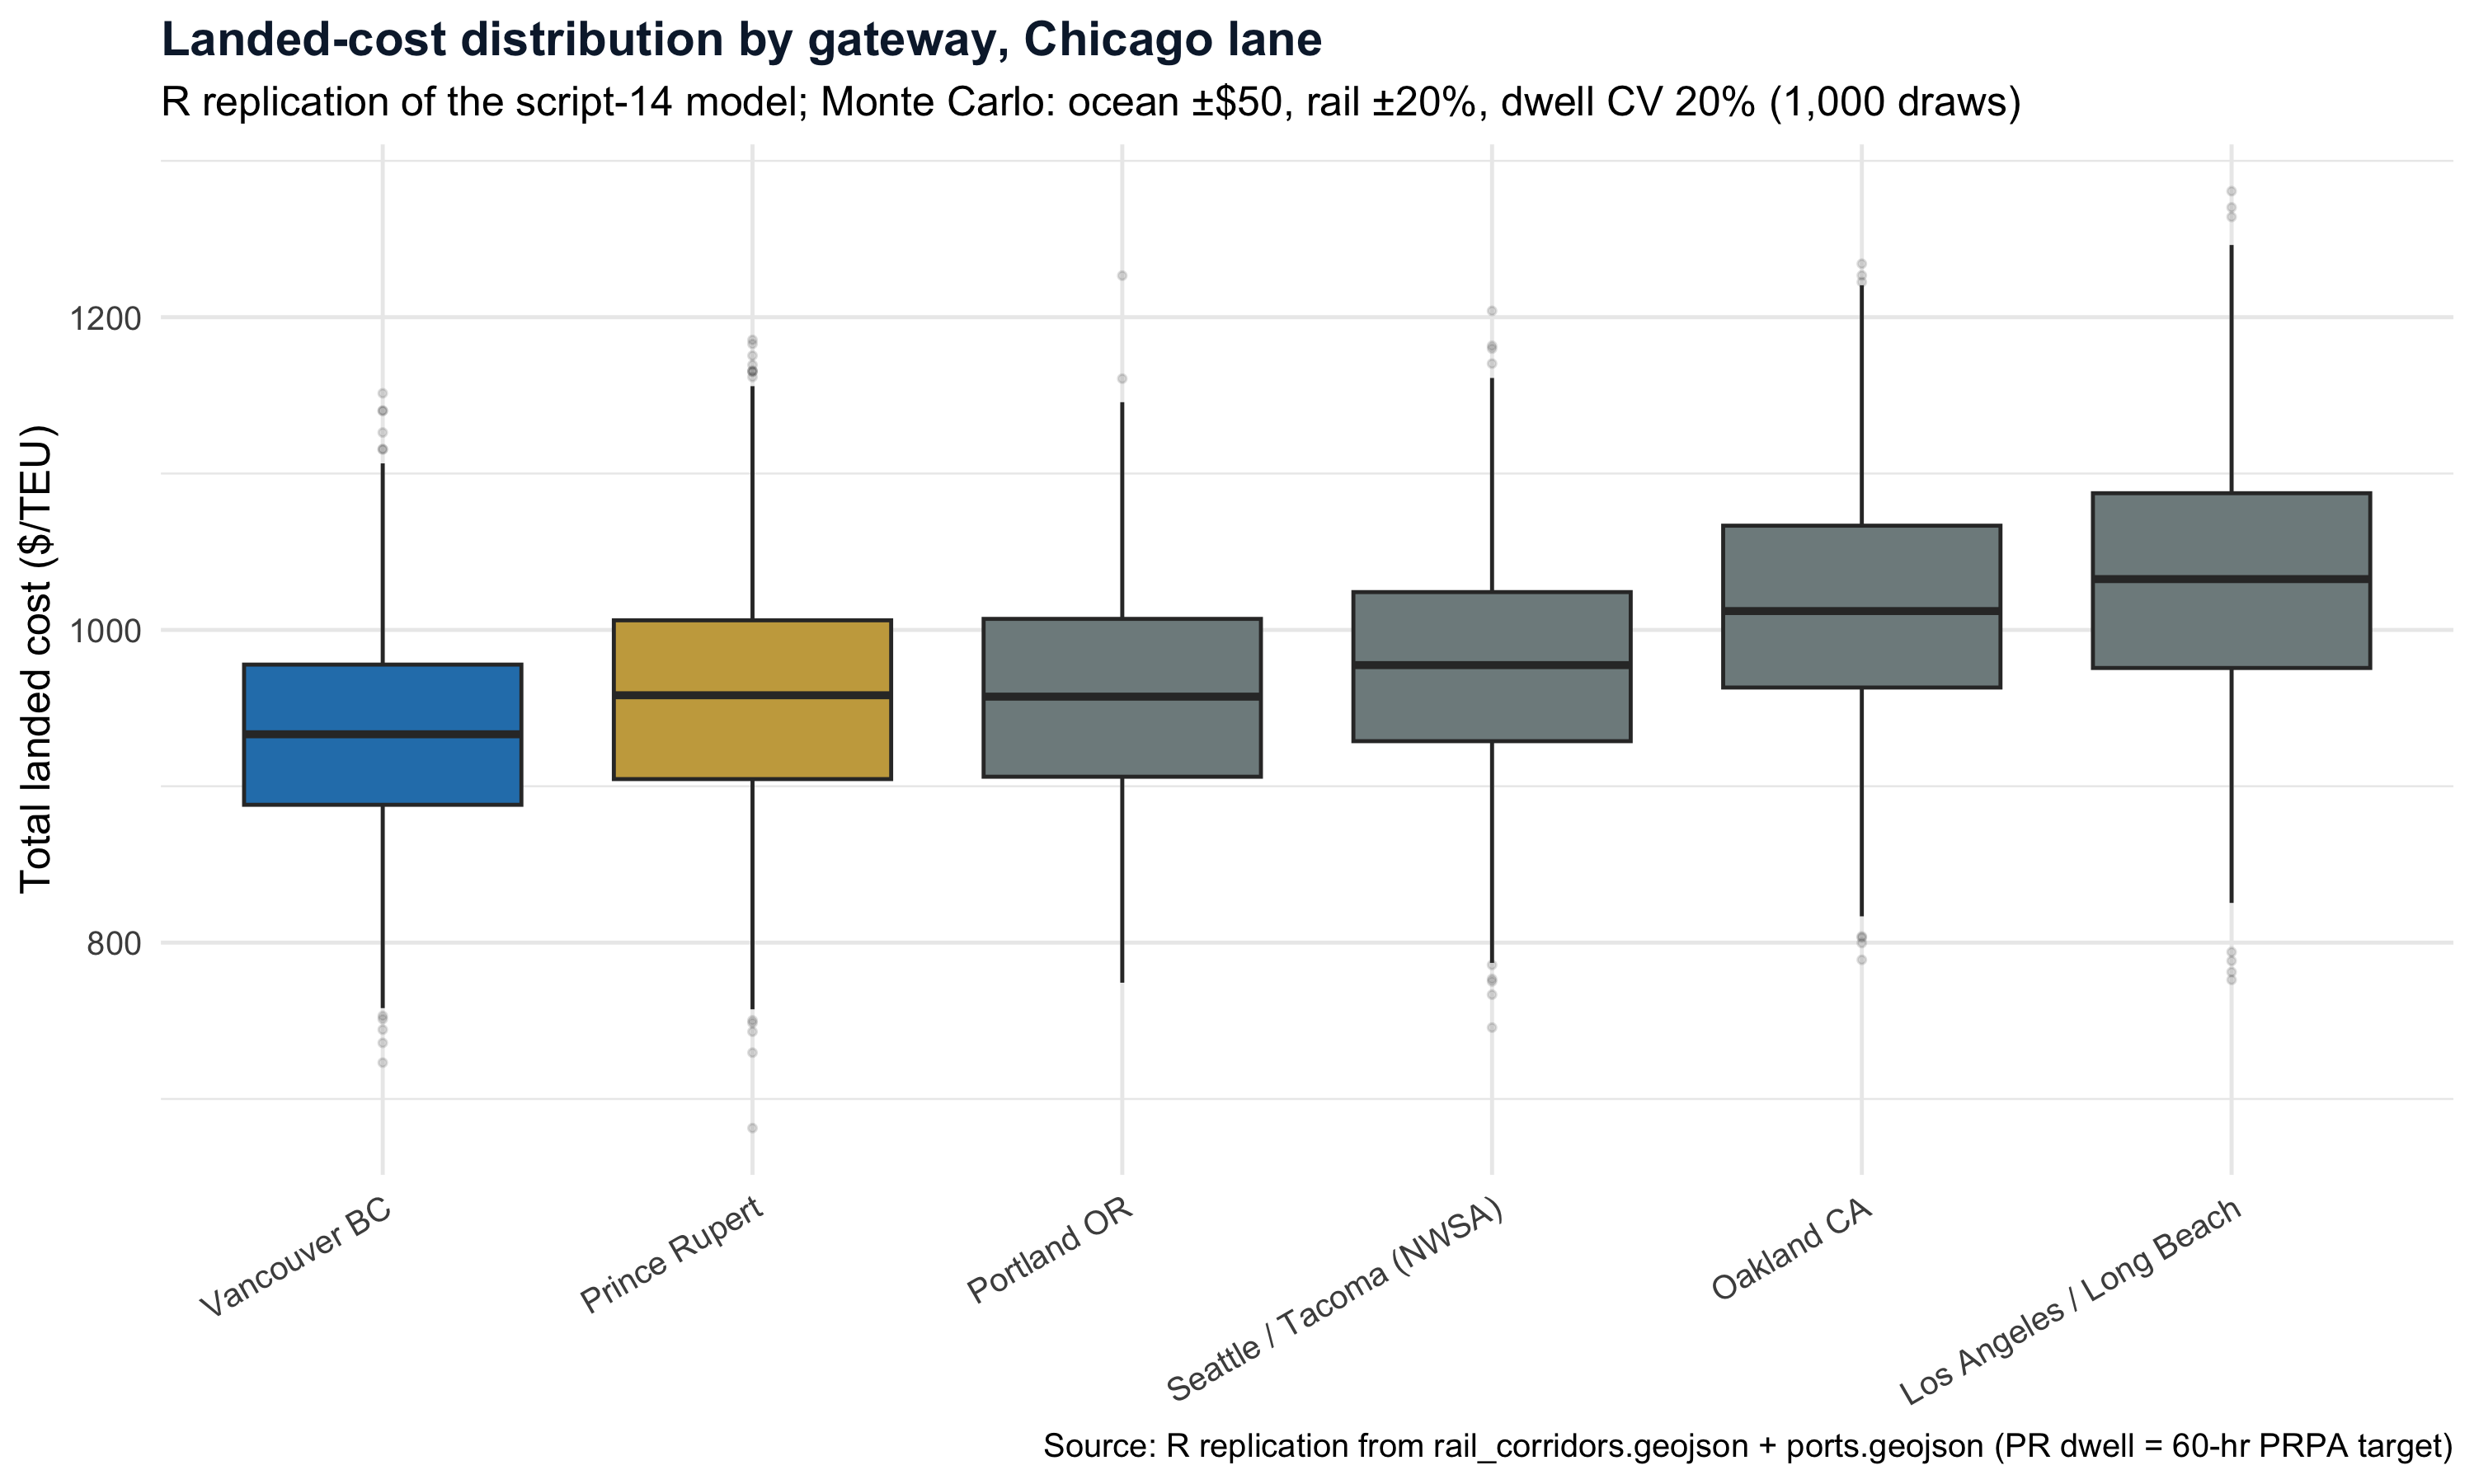
Modelled total landed cost per TEU on the Shanghai -> Chicago lane, across 72 modelled rows. Time advantage and cost advantage are different questions, and this model answers the second one differently from the first.
| Port | Landed cost (USD / TEU) |
|---|---|
| Vancouver BC | $932.56 |
| Prince Rupert | $956.04 |
| Portland OR | $956.28 |
| Seattle / Tacoma (NWSA) | $974.72 |
| Oakland CA | $1,011.72 |
| Los Angeles / Long Beach | $1,034.40 |
| Assumption | Value (USD) |
|---|---|
| Ocean freight per teu | 350.00 |
| Rail rate per km per teu | 0.08 |
| Demurrage rate per day | 50.00 |
| Drayage flat fee | 150.00 |
The assumptions travel with the figures deliberately. A landed-cost number without its rate assumptions is not a finding, it is an advertisement.
6. The corridor itself
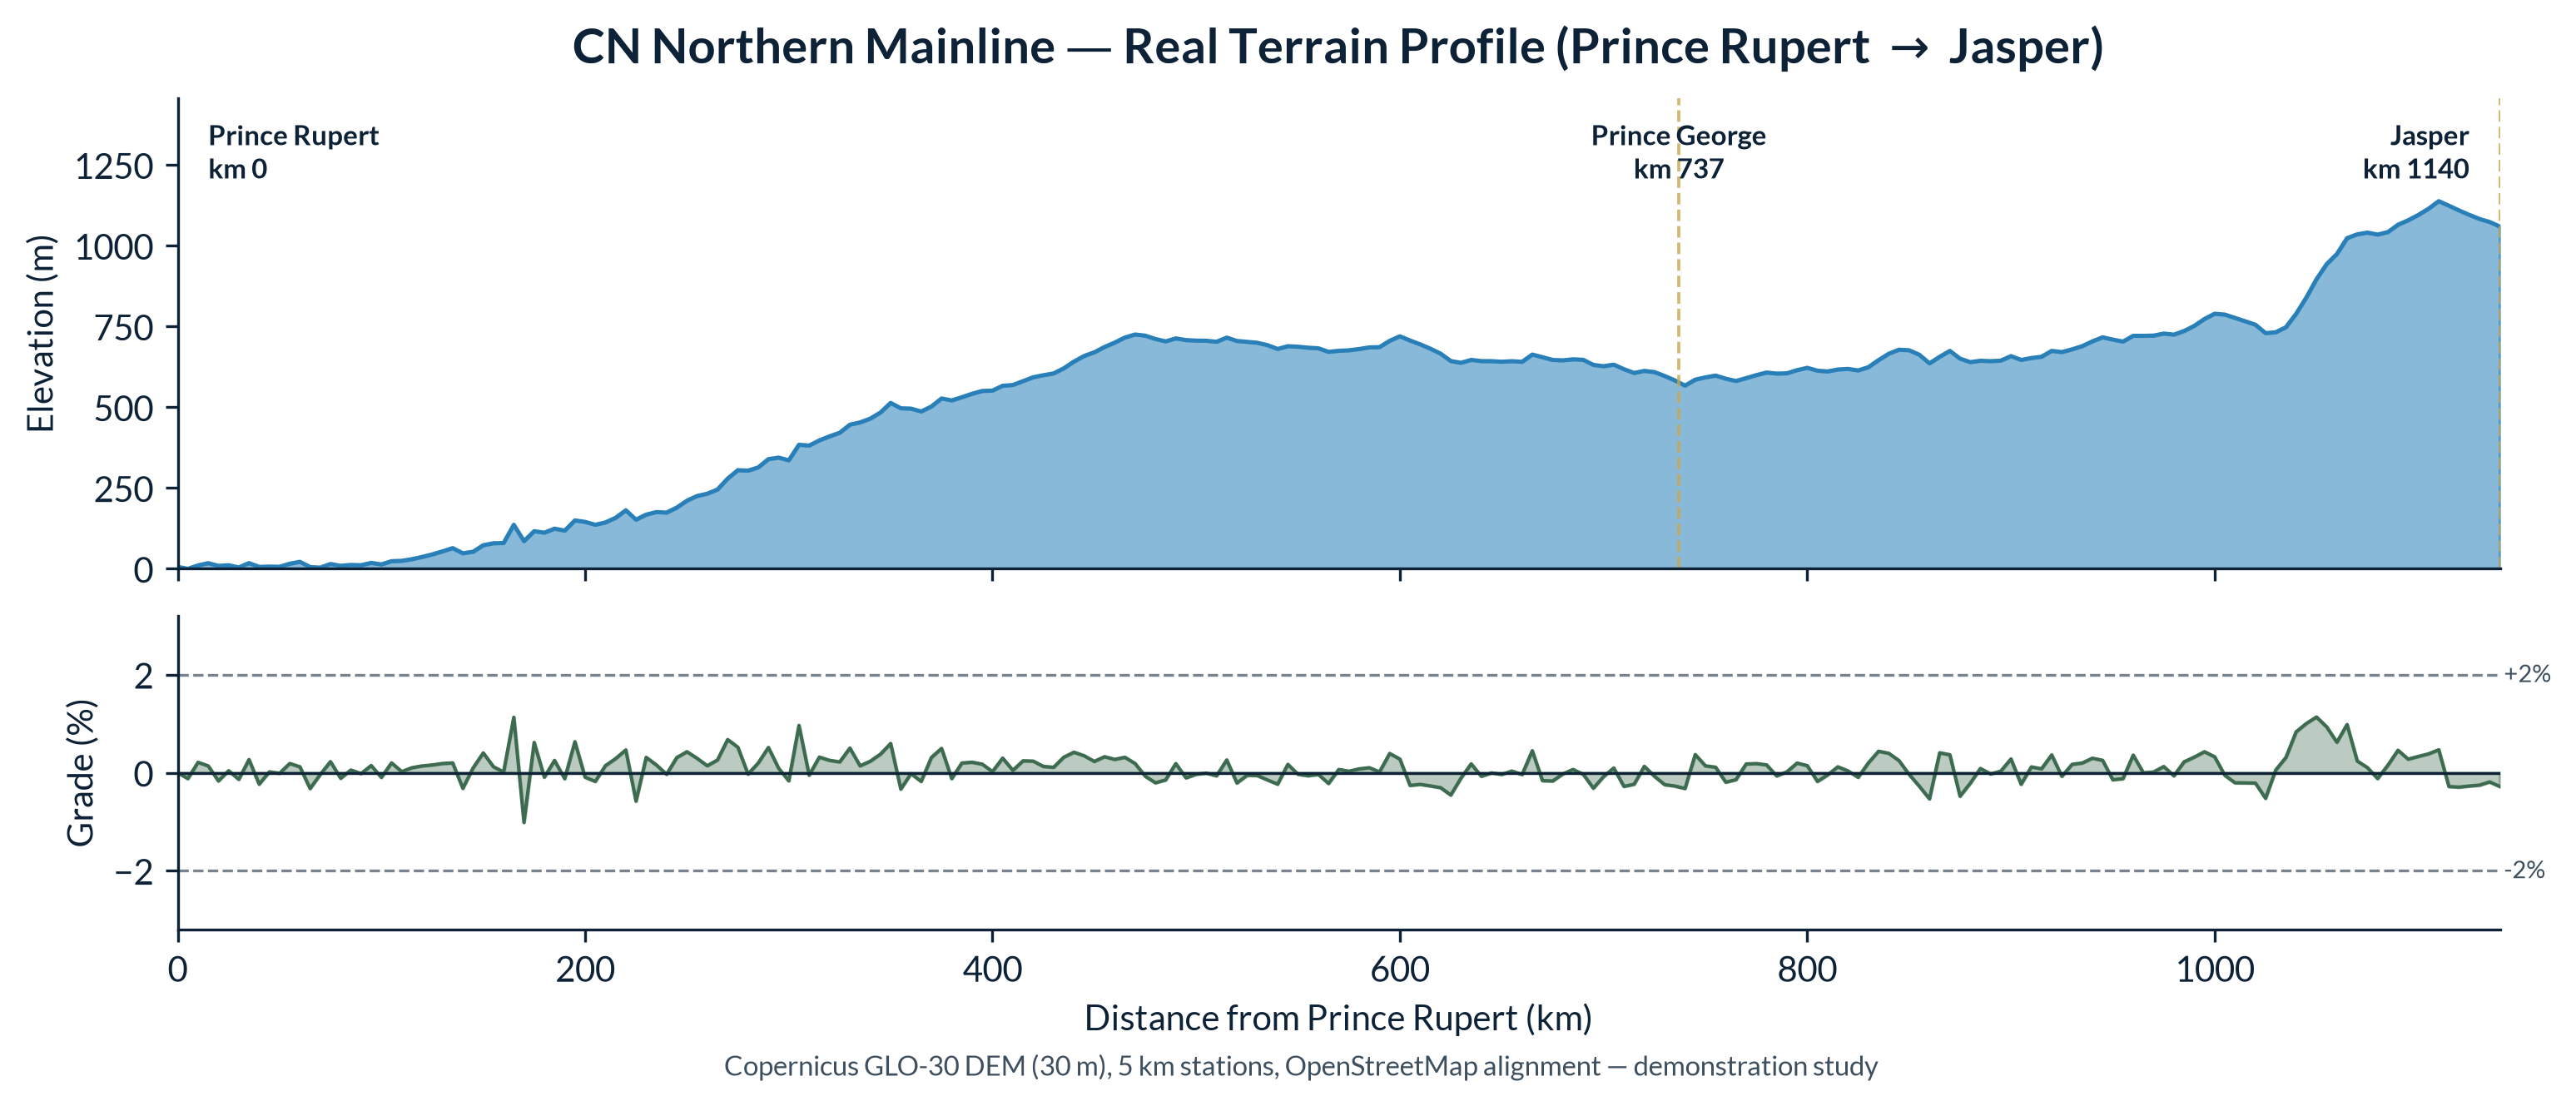
The CN northern mainline answers to the same physiographic fact the Nuxalk-Carrier grease trail did: a comparatively low crossing of the Coast Mountains to a protected Pacific harbour. The modern corridor is faster, heavier, and more capital-intensive, but it is not geographically novel.
- Corridor length
- 1,140 km
Prince Rupert to Jasper.
- Maximum grade
- 1.136%
Mean 0.234% across 229 sampled points.
- Summit elevation
- 1,137.9 m
Mean 533.1 m along the alignment.
- Elevation source
- Copernicus GLO-30
30 m resolution, CC BY 4.0.
| Lane | Shortest-path distance (km) |
|---|---|
| Prince Rupert → Chicago | 4,138 |
| Prince Rupert → Toronto | 4,748 |
| Prince Rupert → Memphis | 4,867 |
| Vancouver BC → Chicago | 3,532 |
| Vancouver BC → Toronto | 4,306 |
| Vancouver BC → Memphis | 4,200 |
| Seattle / Tacoma (NWSA) → Chicago | 3,434 |
| Seattle / Tacoma (NWSA) → Toronto | 4,223 |
| Seattle / Tacoma (NWSA) → Memphis | 4,044 |
| Portland OR → Chicago | 3,516 |
| Portland OR → Toronto | 4,306 |
| Portland OR → Memphis | 3,922 |
| Oakland CA → Chicago | 3,584 |
| Oakland CA → Toronto | 4,373 |
| Oakland CA → Memphis | 3,774 |
| Los Angeles / Long Beach → Chicago | 3,555 |
| Los Angeles / Long Beach → Toronto | 4,330 |
| Los Angeles / Long Beach → Memphis | 3,329 |
Cross-validation: Measured shortest paths cross-checked against published passenger-route mileages (Amtrak Empire Builder / Southwest Chief / California Zephyr, VIA Canadian) in validate_claims.py; Oakland->Chicago follows the UP Overland freight route via Cheyenne-Ogden, ~340 km shorter than the Zephyr's Denver/Moffat passenger routing.
Sources and uncertainty
- Maritime distances: NGA Pub. 151 Distances Between Ports, Pub. 151 leg composites, and routed distances where the pair is unlisted. Display geometry is a great-circle arc; the tabulated distance is the practical sea lane.
- Port facilities: Prince Rupert Port Authority, Port of Vancouver, NWSA, Port of Portland, Port of Oakland, and POLA/POLB public disclosures.
- Dwell times: PRPA published target; Port of Vancouver terminal performance dashboard (June 2026); Pacific Merchant Shipping Association San Pedro Bay report (April 2026). Seattle/Tacoma, Portland, and Oakland are illustrative placeholders; the Port Edward bulk figure is a modelling assumption.
- Rail: OpenStreetMap railway=rail main tracks (service=* excluded), shortest-path stitched; scripts 19-20, 2026-08 Transit times from CN comments to FMC Docket 11-19, CPKC Network Intermodal Service Schedule Matrix (April 2026), and BNSF NWSA service announcement (April 2025).
- Elevation: Copernicus GLO-30 digital elevation model, 30 m resolution, CC BY 4.0.
- Indigenous territories: Native Land Digital (native-land.ca).
Every figure on this page is generated directly from the analysis pipeline rather than transcribed, and a continuous integration check fails the site build if the published numbers drift from the pipeline that produced them.
Explore the corridor interactively
The same data drives an interactive map of the corridor — port infrastructure, the CN northern mainline, transpacific sea lanes, and the historical travel routes that preceded them.