This post is part of the free monthly snapshot series. Subscribe via email for the latest updates, or upgrade to the professional edition for full data access.
PNW Monthly Snapshot
Pacific Northwest Economic Intelligence — Free Edition
2026-07 | Generated by Mamook LLC
The Story This Month
The Pacific Northwest labor market in 2026-07 shows Oregon at 4.8% unemployment and Washington at 4.8% — but the county map tells a more complicated story than the state averages suggest.
Housing markets continue to diverge from wage growth. The typical Portland-area home is valued at $552,022 (Zillow middle-tier estimate). The question isn’t whether prices are high; it’s whether they’re sustainable against the regional wage base.
The Map
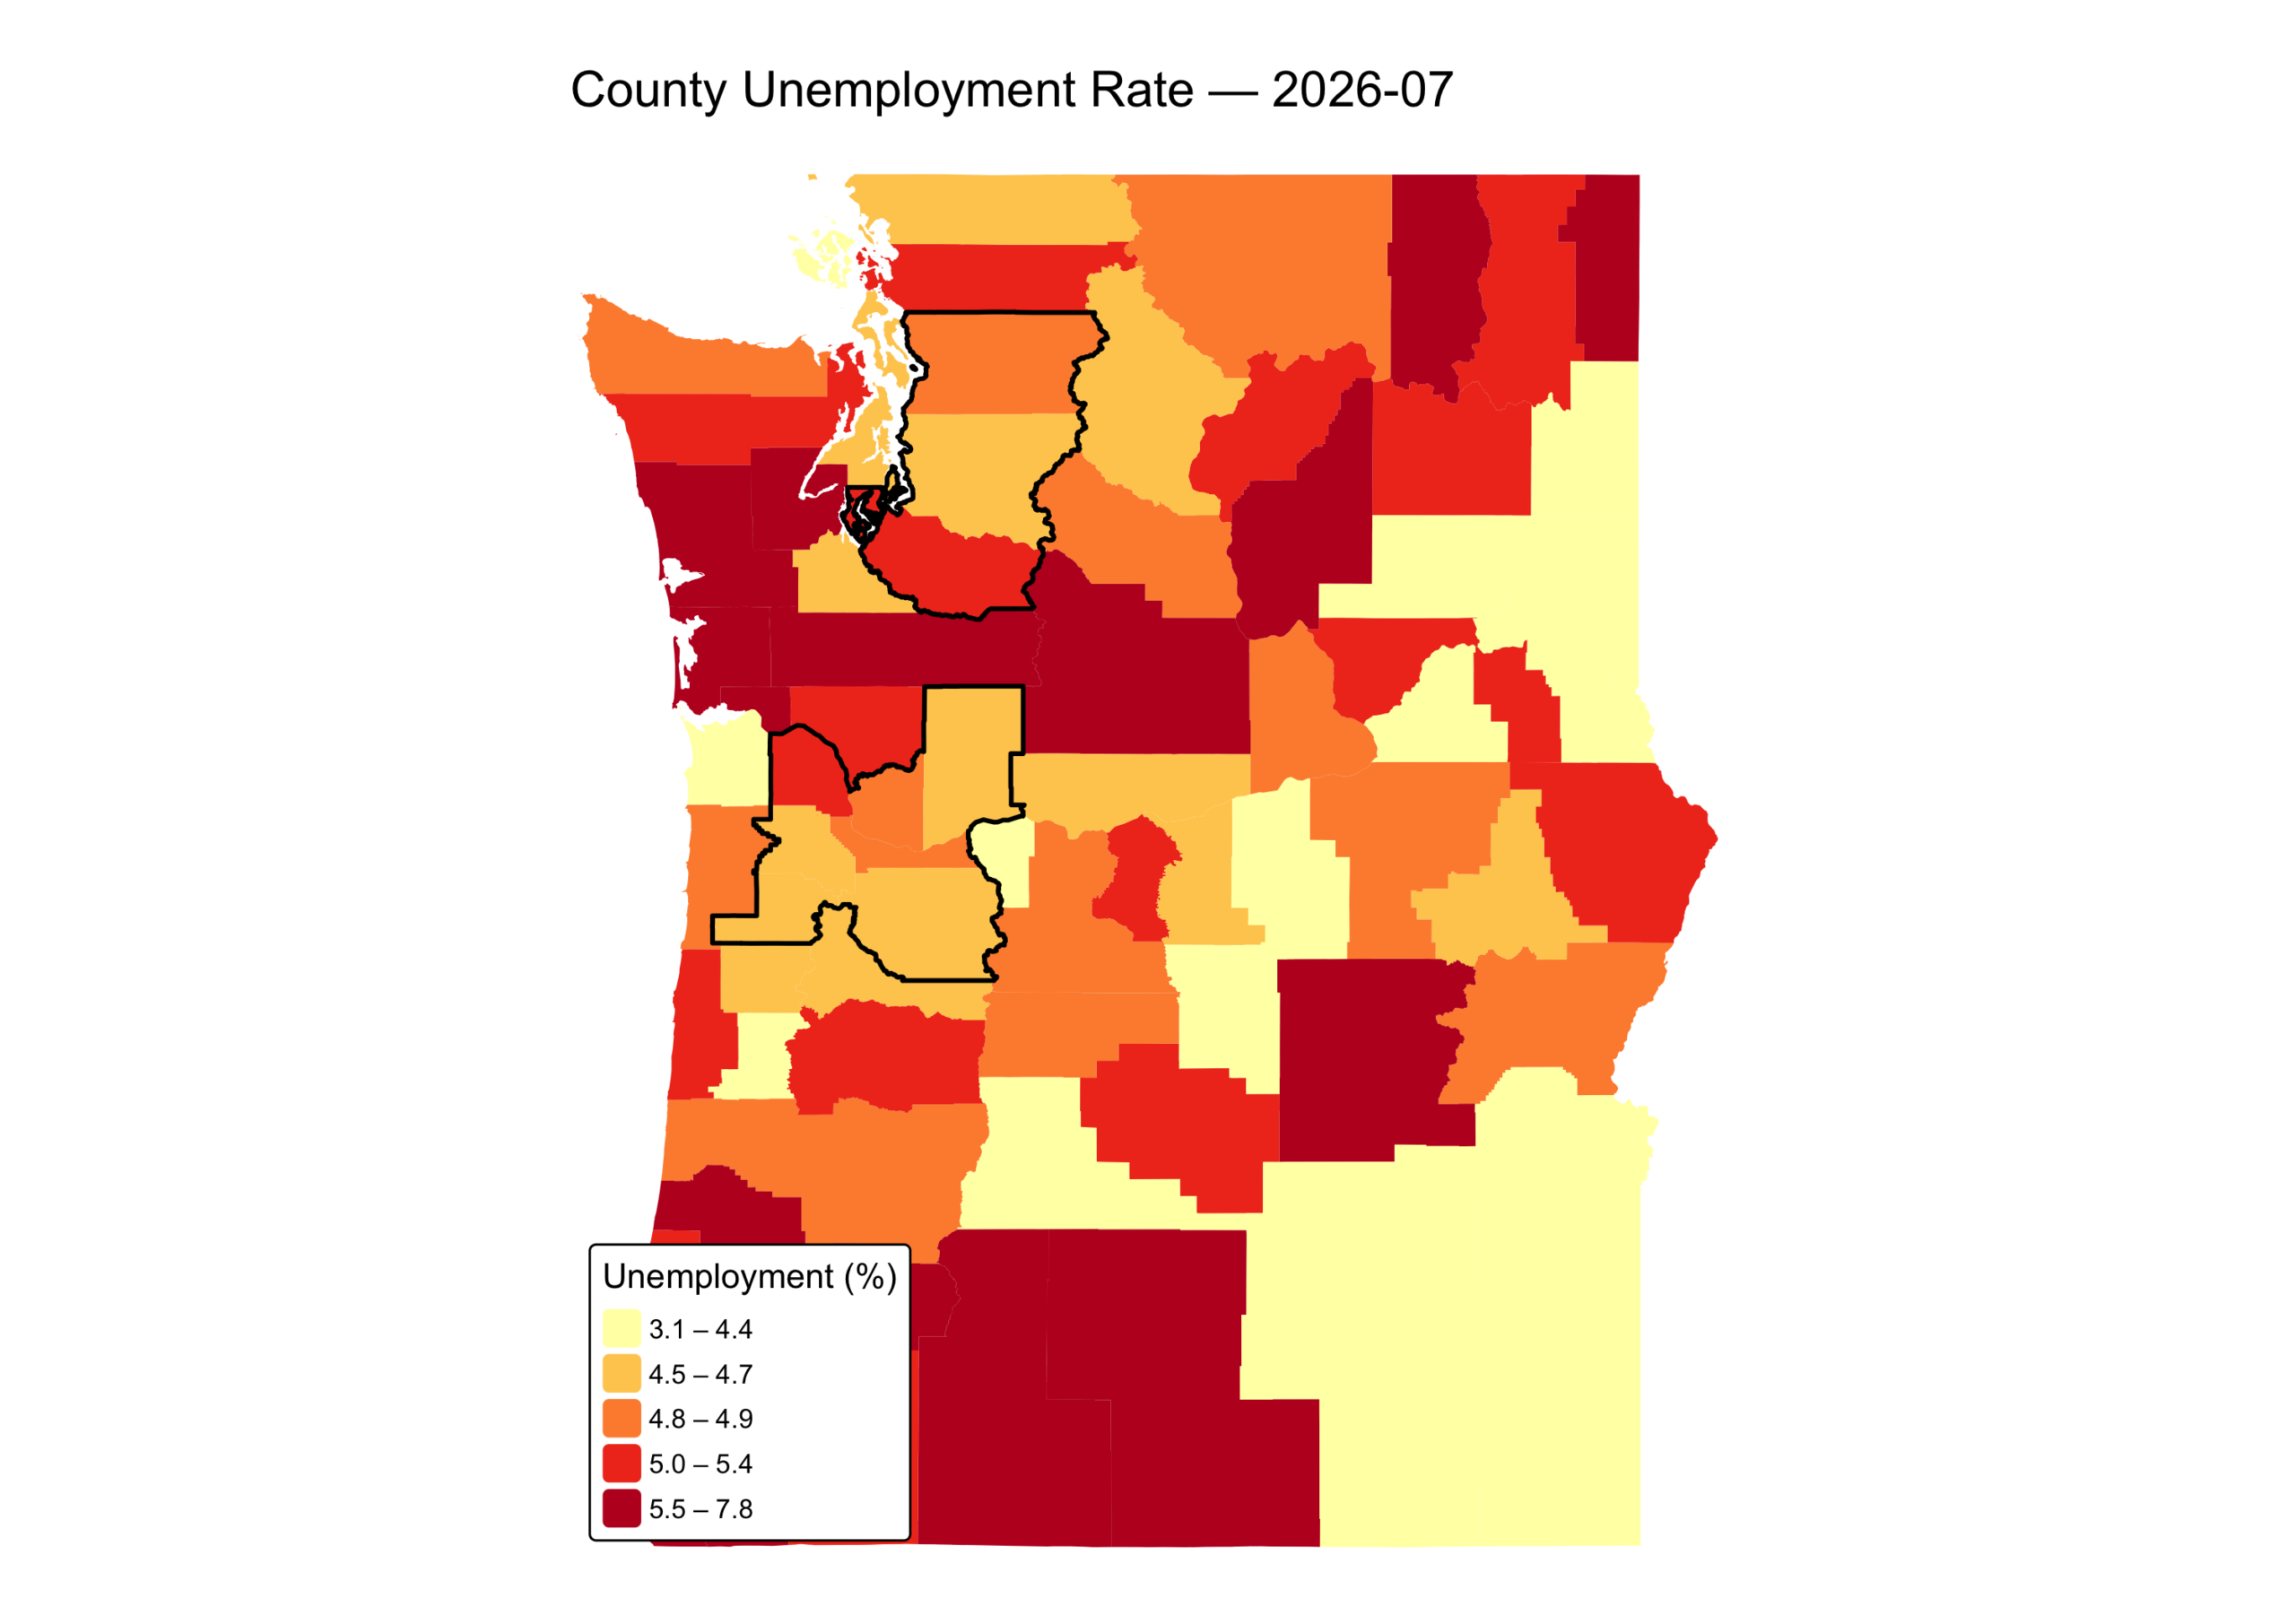
County unemployment rates across Oregon and Washington. Darker shades indicate higher unemployment. Federal data does not disaggregate by tribal affiliation.
Key Numbers
| Metric | Oregon | Washington | What It Means |
|---|---|---|---|
| Unemployment Rate | 4.8% | 4.8% | Statewide average; urban-rural divide is starker |
| Typical Home Value (Portland MSA) | $552,022 | — | Middle-tier homes; not median income-adjusted |
Sources: U.S. Bureau of Labor Statistics (LAUS); Zillow Research (ZHVI). All figures preliminary and subject to revision.
Watch the county spread. A 4.7 percentage-point gap between the lowest- and highest-unemployment counties means the region is effectively running two labor markets in parallel. If the spread widens further, expect pressure on rural service sectors, out-commuting, and eventually out-migration from high-unemployment counties.
This data comes from the traditional and ancestral territories of the Chinook, Clatsop, Tillamook, Warm Springs, Cowlitz, Puyallup, Suquamish, Lummi, Yakama, Umatilla, and many other Pacific Northwest nations.
Federal data does not include tribal economic indicators. The omission is a methodological limitation, not a claim that these economies do not exist.
Want the full picture?
The professional PNW Economic Atlas includes interactive county maps, 12-month trends, peer MSA comparisons, sectoral analysis, raw data downloads, and mid-month alerts.
Get this snapshot delivered to your inbox every month — subscribe free. For professionals who need the full interactive maps, raw data, and alerts: PNW Economic Atlas ($200/mo).